SENSEX is India’s oldest and most widely tracked stock market benchmark index. It is country’s first equity index which launched on 2nd Jan 1986 with the Base Value of 100 as on year 1978-79.
Short Brief About BSE & Sensex
Bombay Stock Exchange (BSE) is India`s older Stock exchange which was established in 1875 as “The Native Share & Stock Brokers’ Association”. At present, there are more than 5500 companies listed on BSE with a total market capitalization of USD 1.64 Trillion as of Sep 2015.
BSE Sensex is the weighted average of 30 large capitalised stocks from wide sectors of Indian economy. The index is a true representor of the performance of the Indian economy. Sensex is traded internationally on the EUREX as well as leading exchanges of the BRCS nations (Brazil, Russia, China and South Africa).
Sensex Vs Nifty
Sensex & Nifty are considered to be almost same as most of these indexes are mirror image to the Indian equities where Sensex is the Index of the Bombay Stock Exchange (BSE) and Nifty 50 is the Index of the National Stock Exchange (NSE).
Sensex is India`s oldest Index launched in 1986 while Nifty 50 was launched after 10 years in 1996 by NSE.
Sensex is a weighted average of most liquid & top capitalized 30 stocks listed on the Bombday Stock Exchange (BSE) while The CNX Nifty Index (preferably Known as NIFTY 50) is a weighted average of most liquid and top capitalized 50 stocks listed on the National Stock Exchange (NSE) that covers 13 sectors of the Indian economy.
The best part of the Index is that the underperforming stocks in the index are replaced by those performing. So, Index always represents that part of the market which are outperformers.
To Know more about Nifty Index, Visit What is Nifty Index (CNX Nifty) & How to Trade Nifty?
Performance of Sensex Since 1979
Sensex has grown from a base price of 100 (1978-79) by many folds to the level of 28000 for the FY ending 2014-15. So, investment of Rs. 1,00,000 invested in Sensex in 1979 will become Rs. 2.8 Crores by the end of FY 2014-15.
1980 to 1992
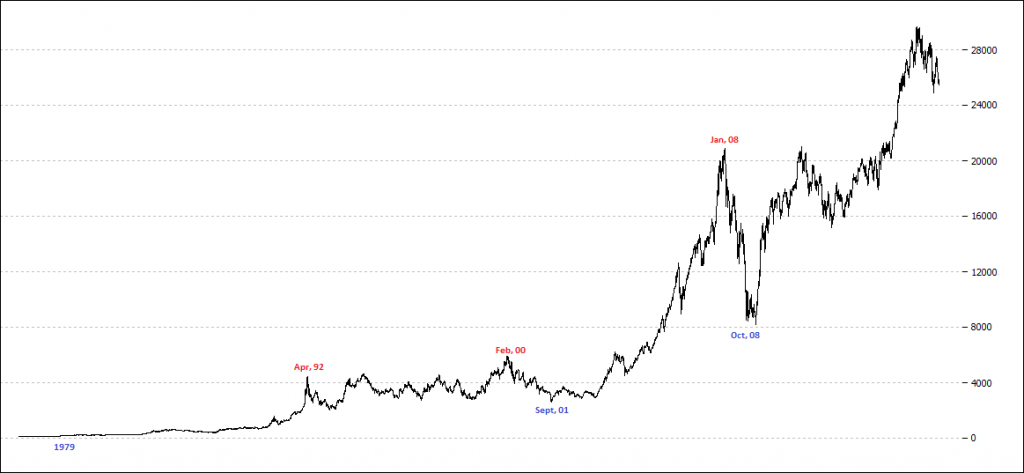
From the chart below, we can see that the bull market which started since 1980 from levels of 100 ran up till April 1992 to the levels of 4500, return of 45 times in just 12 years. Within this phase, we even seen a 2 year bear market from 1986 to 1988 and a major crash during the end months of 1990.

1992 Bear Market & Economic Liberalization of 1990s
Economic liberalization in India from the early 1990s till early 2000s led to a drastic transition in the Indian economy where Foreign Institutional Investors (FIIs) were allowed to invest in all securities traded on the primary and secondary markets, including shares, debentures and warrants of the companies listed on the Stock Exchanges in India.
The year 1992 outbreaks the security scam led by Harshad Mehta, who was engaged in a massive stock manipulation which exposed the loopholes in the Bombay Stock Exchange transaction system. This security scam was more of a banking scam as this was led by two banks – the Bank of Karad (BOK) and the Metorpolitan Co-operative Bank (MCB) which issued fake Bank Receipts (BR) certifying the seller holds the securities and promises to deliver the securities to the buyer.
This forced the market to correct from 4500 to 2000 mark within a year and leads to introduction of new rules by SEBI to cover those loopholes and a support to the liberalization of the economic structure.
Technically speaking, such a big time of one decade actually leads to a resting period for the market, after the bull market, where sensex registers a negative return of 40% in 9 years from the year 1992 (Levels of 4500) till 2001 (Levels of 2600). During this phase, Indian stock market witnesses two major bear markets in 1992 & 2000.
In 2000, World markets witnessed another bear cycle by the advent of the dot-cot bubble or internet bubble. This led our market to undergo big correction phase for more than 1.5 years from the price level of 6200 to 2600 and caused loss of billions of dollars from the market capitalization.
Post Liberalization Phase – Bull Market from 2003 to 2008
After the bear market of 2000-01, the market went under the bull market or growth phase post liberalization started from 2003 onwards. Such a bull market helped our index to see new heights and growing phase for all the major companies in India. The index seen the levels to grow from 2900 odd levels of 2003 to 21000 in early 2008, a growth of 600% within 5 years.
This period also includes a major election period won by congress party in May 2004 where index corrects from 6200 to 4200 from Jan-May 2004.
2008 US Sub-Prime Crises / 2008 Correction of the Bull Markets
Global crises of 2007-08, which leads to failures of massive financial institutions in the United States, primarily due to exposure of securities of sub prime loans devolved into a global crisis resulting in a number of bank failures in Europe and sharp reductions in the value of stocks and commodities worldwide. This had major impact on the world markets and witnessed major corrections of the bull markets ending 2007-08.
So, the bull market which ended in Jan 2008 had its sharpest drop and one of the fastest bear market of all time where Sensex falls from 21000 peak levels to 8000 levels in 2008 end or early 2009. The weeks beginning October 6 was the worst weekly decline ever on both a point and percentage basis in the world markets.
Post Sub Prime Crises (2009 – 2015)
Started 2009, Economies recovered very fast from the crises and Indian markets also seen the major pullback and start of another bull market in continuation of the earlier bull market. So, the market which recovered from 2009 from 8000 levels break through the 2008 prices of 21000 in 2014 where we seen this bull run to continue till early 2015 to the all time high levels of 30000. This phase from 2009 till early 2015 seen a growth of 275% within these 6 years and still we are under this big cyclical up phase where markets are undergoing in correction of the bull moves seen earlier till 2015.
Performance of Sensex Since 1979
From the table and chart below, we can see that the Sensex has grown from a base price of 100 (1978-79) by many folds to the level of 28000 as on FY 2014-15.
Investment of Rs. 1,00,000 invested in Sensex in 1979 will become Rs. 2.8 Crores by the end of FY 2014-15 if one stays invested for this 3.5 decade cycle. Such a return generates an annulized return of approx 17-18% (Excluding Inflation) every year outperforming the returns of the fixed deposits or other financial product returns.
| Year | Values | Return (Y-Y) | Investment Value |
| 1978-79 | 100 | – | 100000 |
| 1979-80 | 128.5 | 29% | 128500 |
| 1980-81 | 173 | 35% | 173000 |
| 1981-82 | 217.5 | 26% | 217500 |
| 1982-83 | 211.5 | -3% | 211500 |
| 1983-84 | 245 | 16% | 245000 |
| 1984-85 | 354 | 44% | 354000 |
| 1985-86 | 574 | 62% | 574000 |
| 1986-87 | 510 | -11% | 510000 |
| 1987-88 | 398 | -22% | 398000 |
| 1988-89 | 714 | 79% | 714000 |
| 1989-90 | 781 | 9% | 781000 |
| 1990-91 | 1168 | 50% | 1168000 |
| 1991-92 | 4285 | 267% | 4285000 |
| 1992-93 | 2281 | -47% | 2281000 |
| 1993-94 | 3779 | 66% | 3779000 |
| 1994-95 | 3261 | -14% | 3261000 |
| 1995-96 | 3367 | 3% | 3367000 |
| 1996-97 | 3361 | 0% | 3361000 |
| 1997-98 | 3893 | 16% | 3893000 |
| 1998-99 | 3740 | -4% | 3740000 |
| 1999-00 | 5001 | 34% | 5001000 |
| 2000-01 | 3604 | -28% | 3604000 |
| 2001-02 | 3469 | -4% | 3469000 |
| 2002-03 | 3049 | -12% | 3049000 |
| 2003-04 | 5591 | 83% | 5591000 |
| 2004-05 | 6493 | 16% | 6493000 |
| 2005-06 | 11280 | 74% | 11280000 |
| 2006-07 | 13072 | 16% | 13072000 |
| 2007-08 | 15644 | 20% | 15644000 |
| 2008-09 | 9708.5 | -38% | 9708500 |
| 2009-10 | 17528 | 81% | 17528000 |
| 2010-11 | 19445 | 11% | 19445000 |
| 2011-12 | 17404 | -10% | 17404000 |
| 2012-13 | 18835 | 8% | 18835000 |
| 2013-14 | 22386 | 19% | 22386000 |
| 2014-15 | 27958 | 25% | 27958000 |
How to Invest in the Sensex?
An investor who wishes to invest and participate in the growth of Indian economy has to get an exposure to the Indian Index. So, he/she has basically two choices:
Option I – Buy all Index Stocks in Same Proportion as in Index
Buy all the thirty stocks in the same proportion as they are in the Sensex index or fifty as in case of Nifty Index. So, the investor has to allocate his capital into ITC Ltd, Infosys Ltd, ICICI Bank in the same proportion as they are in the index. This will create a basket of top cap stocks which will result in similar returns as will be registered by the Sensex or Nifty Index during the same period of investment.
Option II – Invest in Index ETF
With the growth and development of new products in the market the task of the investor has become easy, convenient and flexible. So, with the introduction of Index ETFs in the market, the investor can seek to match the performance of the Index by investing in ETFs units.
As at present, there are no liquid Sensex ETF is available to invest in for Indian investors. But Index ETF for Nifty is available in the market which is owned by Goldman Sacs which in this case is NiftyBees.
The Nifty Bees fund holds all of the CNX Nifty 50 index stocks and seeks to match the performance and yield of the CNX Nifty 50 Index before fees and expenses. NiftyBees ETF seeks to replicate, net of expenses, the Nifty Index. At present, NiftyBees is quoting at Rs. 800 approximately 1/10th of the Index Level. It has to be kept in mind that the goal of an Index ETF is to emulate an underlying index, not outperform it.
Any institution to have international exposure in India or to hedge foreign investing risk prefer investing via Index ETFs. Same applies in case of the individual investors, they can buy Nifty Index ETF for the allotted capital to get exposure to the Indian market. So, to match and replicate the performance of the Indian equity market on the broad basis, any investor has to track and invest in Index ETF.
As oulined above, the best part of the investment in the index is that the underperforming stocks in the index are replaced by those performing. So, Index always represents that part of the market which are outperformers.
To Know more about NiftyBees ETF, Visit What is NiftyBees & How to Invest in NiftyBees?
KNOWLEDGE IS POWER!


