The CNX Nifty 50 Index is one of the best-known icons of Indian economy and among stock market observers around the world. The CNX Nifty 50 Index (preferably Known as NIFTY) is a weighted average of most liquid and top capitalized 51 stocks listed on the National Stock Exchange (NSE) that covers 23 sectors of the Indian economy. Nifty represents about 65% of the free float market capitalization of the 1600 stocks listed on NSE as on March 31, 2016. It is a broad based benchmark that offers exposure to the Indian market in one efficient portfolio.
Index Methodology
The CNX Nifty Index is computed using free-float adjusted market capitalization with base date of Nov 3, 1995 indexed to base value of 1000. The level of the index reflects the market value of all the stocks in the index relative to particular base market capitalization value.
Sector Allocation
The following chart displays the Sector Representation of the CNX Nifty 50 Index sorted by weight.
[visualizer id=”763″]
Nifty 50 Index Constituents
| Sr. No | Security Name | Free Float Market Cap (Rs. Crores) | Weightage (%) | Beta | Volatility (%) |
| 1 | Infosys Ltd. | 2,20,695 | 7.78 | 0.74 | 1.31 |
| 2 | HDFC Bank Ltd. | 2,14,129 | 7.55 | 0.89 | 0.78 |
| 3 | Housing Development Finance Corporation Ltd. | 1,99,437 | 7.03 | 1.36 | 1.31 |
| 4 | I T C Ltd. | 1,84,144 | 6.49 | 0.75 | 1.83 |
| 5 | Reliance Industries Ltd. | 1,67,546 | 5.91 | 1.16 | 1.52 |
| 6 | ICICI Bank Ltd. | 1,51,897 | 5.36 | 1.5 | 1.51 |
| 7 | Tata Consultancy Services Ltd. | 1,25,505 | 4.43 | 0.57 | 0.92 |
| 8 | Larsen & Toubro Ltd. | 1,04,508 | 3.68 | 1.18 | 0.79 |
| 9 | Sun Pharmaceutical Industries Ltd. | 89,396 | 3.15 | 0.88 | 1.86 |
| 10 | Tata Motors Ltd. | 75,680 | 2.67 | 1.31 | 1.38 |
| 11 | Axis Bank Ltd. | 75,255 | 2.65 | 1.44 | 1.14 |
| 12 | Kotak Mahindra Bank Ltd. | 74,129 | 2.61 | 1.06 | 1.01 |
| 13 | State Bank of India | 69,381 | 2.45 | 1.37 | 1.01 |
| 14 | Hindustan Unilever Ltd. | 61,208 | 2.16 | 0.53 | 1.22 |
| 15 | Maruti Suzuki India Ltd. | 61,145 | 2.16 | 0.78 | 0.9 |
| 16 | Mahindra & Mahindra Ltd. | 58,824 | 2.07 | 1 | 1.77 |
| 17 | HCL Technologies Ltd. | 47,506 | 1.68 | 0.73 | 1.26 |
| 18 | Bharti Airtel Ltd. | 47,013 | 1.66 | 0.72 | 1.64 |
| 19 | IndusInd Bank Ltd. | 47,204 | 1.66 | 1.1 | 1.06 |
| 20 | Lupin Ltd. | 44,221 | 1.56 | 0.75 | 1.59 |
| 21 | Oil & Natural Gas Corporation Ltd. | 43,377 | 1.53 | 1.06 | 1.85 |
| 22 | Coal India Ltd. | 42,392 | 1.49 | 0.74 | 1.63 |
| 23 | Asian Paints Ltd. | 40,008 | 1.41 | 0.97 | 1.38 |
| 24 | Dr. Reddy’s Laboratories Ltd. | 39,501 | 1.39 | 0.73 | 1.58 |
| 25 | Wipro Ltd. | 36,008 | 1.27 | 0.64 | 0.76 |
| 26 | Bajaj Auto Ltd. | 34,515 | 1.22 | 0.82 | 1.38 |
| 27 | Cipla Ltd. | 32,983 | 1.16 | 1.09 | 0.99 |
| 28 | Hero MotoCorp Ltd. | 32,864 | 1.16 | 0.71 | 1.12 |
| 29 | Tech Mahindra Ltd. | 31,943 | 1.13 | 0.55 | 1.43 |
| 30 | Power Grid Corporation of India Ltd. | 31,092 | 1.1 | 0.67 | 1.28 |
| 31 | NTPC Ltd. | 30,198 | 1.06 | 0.89 | 1.1 |
| 32 | UltraTech Cement Ltd. | 28,470 | 1 | 1.12 | 1.23 |
| 33 | Grasim Industries Ltd. | 23,894 | 0.84 | 0.82 | 0.88 |
| 34 | Yes Bank Ltd. | 23,732 | 0.84 | 1.5 | 1.38 |
| 35 | Zee Entertainment Enterprises Ltd. | 23,908 | 0.84 | 1.05 | 1.44 |
| 36 | Adani Ports and Special Economic Zone Ltd. | 23,632 | 0.83 | 1.24 | 1.72 |
| 37 | Bharat Petroleum Corporation Ltd. | 23,059 | 0.81 | 0.88 | 1.33 |
| 38 | GAIL (India) Ltd. | 17,438 | 0.61 | 1.05 | 1.93 |
| 39 | Tata Steel Ltd. | 17,321 | 0.61 | 1.5 | 2.25 |
| 40 | Bosch Ltd. | 16,875 | 0.6 | 1.14 | 1.17 |
| 41 | Idea Cellular Ltd. | 16,118 | 0.57 | 0.66 | 1.37 |
| 42 | Ambuja Cements Ltd. | 15,667 | 0.55 | 1.15 | 1.1 |
| 43 | Bharat Heavy Electricals Ltd. | 15,294 | 0.54 | 1.13 | 1.46 |
| 44 | Bank of Baroda | 14,713 | 0.52 | 1.37 | 1.14 |
| 45 | ACC Ltd. | 12,727 | 0.45 | 0.82 | 0.92 |
| 46 | Tata Power Co. Ltd. | 12,300 | 0.43 | 1.1 | 1.38 |
| 47 | Hindalco Industries Ltd. | 10,904 | 0.38 | 1.36 | 2.23 |
| 48 | Vedanta Ltd. | 9,950 | 0.35 | 1.68 | 2.52 |
| 49 | Punjab National Bank | 8,614 | 0.3 | 1.26 | 1.38 |
| 50 | Cairn India Ltd. | 7,844 | 0.28 | 1.33 | 2 |
| 28,36,169 | 1 |
* As on Dec 31st, 2015
** Beta measures the degree to which any portfolio of stocks is affected as compared to the effect on the whole market.
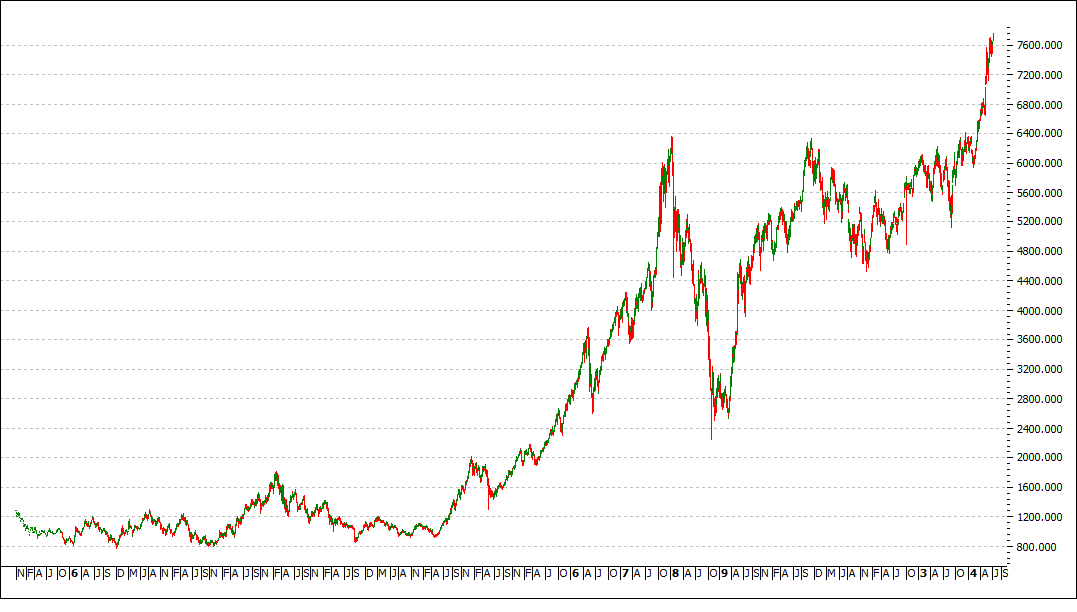
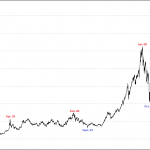
Historical Timeline
Chart – I below displays the Daily CNX Nifty Spot Chart
Milestones
| Date | Daily Net Gains |
| 18 May, 2009 | +651.5 |
| 25 Jan, 2008 | +349.90 |
| 23 Jan, 2008 | +304.09 |
| 23 Oct, 2013 | +289.7 |
| 14 Feb, 2008 | +272.55 |
| Date | Daily % Gains |
| 18 May, 2009 | +17.74% |
| 18 May, 2004 | +8.30% |
| 16 Apr, 1999 | +7.83% |
| 3 Jan, 3000 | +7.55% |
| 17 June, 1998 | +7.30% |
| Date | Daily Net Loss |
| 21 Jan, 2008 | -496.5 |
| 24 Oct, 2008 | -359.15 |
| 22 Jan, 2008 | -309.5 |
| 17 Dec, 2007 | -270.7 |
| 03 Mar, 2008 | -270.5 |
| Date | Daily % Losses |
| 17 May, 2004 | -12.24% |
| 24 Oct, 2008 | -12.20% |
| 21 Jan, 2008 | -8.70% |
| 31 Mar, 1997 | -8.46% |
| 28 Oct, 1997 | -7.87% |
| Date | Record |
Recent Changes of Stocks in Nifty 50 Index Since 2015
| Index Name | Event Date | Scrip Name | Description |
| Nifty 50 | 27-03-2015 | DLF Ltd. | Exclusion from Index |
| Nifty 50 | 27-03-2015 | Jindal Steel & Power Ltd. | Exclusion from Index |
| Nifty 50 | 27-03-2015 | Idea Cellular Ltd. | Inclusion into Index |
| Nifty 50 | 27-03-2015 | Yes Bank Ltd. | Inclusion into Index |
| Nifty 50 | 29-05-2015 | IDFC Ltd | Exclusion from Index |
| Nifty 50 | 29-05-2015 | Bosch Ltd. | Inclusion into Index |
| Nifty 50 | 28-09-2015 | NMDC Ltd. | Exclusion from Index |
| Nifty 50 | 28-09-2015 | Adani Ports and Special Economic Zone Ltd. | Inclusion into Index |
| Nifty 50 | 01/04/2016 | Cairn India Ltd. | Exclusion from Index |
| Nifty 50 | 01/04/2016 | Punjab National Bank | Exclusion from Index |
| Nifty 50 | 01/04/2016 | Vedanta Ltd. | Exclusion from Index |
| Nifty 50 | 01/04/2016 | Aurobindo Pharma Ltd. | Inclusion into Index |
| Nifty 50 | 01/04/2016 | Bharti Infratel Ltd. | Inclusion into Index |
| Nifty 50 | 01/04/2016 | Eicher Motors Ltd. | Inclusion into Index |
| Nifty 50 | 01/04/2016 | Tata Motors Ltd DVR | Inclusion into Index |
Nifty Futures
Future contract on Nifty 50 Index was launched on June 12th, 2000. Nifty Futures derive its value from its underlying i.e. CNX Nifty Index.
Given below are the Contract Specifications of Nifty Futures:-
| Ticker Symbol | Nifty |
| Contract Size | 75 Units |
| Contract Value | 5,70,000 (7,600 x 75) |
| Tick Size | .05 |
| Trading Hours | Monday – Friday : 9:15AM – 3:30PM |
| Expiry Date | Last Thursday of the contract month |
| Trading Cycle | 3-month trading cycle – the near month , the next month and the far month. |
| Daily Settlement Price | Last half hour’s weighted average price |
| Final Settlement Price | Final settlement price for a Nifty futures contract shall be the closing price of the underlying index (CNX Nifty Index) in the Normal Market of the Capital Market segment of NSE on the last trading day of such futures contract. |
| Final Settlement Procedure | Final settlement will be Cash settled in INR based on final settlement price. |
| Settlement | All the Futures Contract are Cash settled in INR. |
Read Article : Trading Futures Market to get a detailed illustration of why to trade futures and how a futures trade actually work.
How to Trade Nifty?
A trader who wishes to get an exposure to the Nifty Index has basically three choices. Let us take an illustration that Mr. Shrinivasan has Rs. 2,00,000 and he wants to utilize this capital to get exposure to the Nifty Index.
Option I – Buy all 50 Nifty Stocks
Buy all the fifty stocks in the same proportion as they are in the Nifty index. So, Mr. Shrinivasan had to allocate 14.1% of Rs. 2 lac to ITC Ltd, 12.4% of Rs. 2 lacs to Infosys Ltd, 11.4% of 2 lacs to ICICI Bank and so on. This will create a basket of 50 top cap stocks which will result in similar returns as will be registered by the Nifty Index during the same period of investment.
Option II – Nifty Index ETF
With the growth and development of new products in the market the task of the investor has become easy, convenient and flexible. So, with the introduction of Index ETFs in the market, the investor can seek to match the performance of the Index by investing in ETFs units, in this case it is Nifty ETF.
So, He can buy Nifty Index ETF worth of Rs. 2,00,000, which is for this example is NiftyBees. NiftyBees ETF seeks to replicate, net of expenses, the Nifty Index. At present, NiftyBees is quoting at Rs. 800 approximately 1/10th of the Index Level.
Option III – Trading Nifty Futures
Buy Nifty futures on margin, taking advantage of approximately 10:1 leverage. Long term traders have to roll over their futures contract as and when existing contract expires.
Future contract on Nifty Index was launched on June 12th, 2000. Nifty Futures derive its value from its underlying i.e. Nifty Index.
KNOWLEDGE IS POWER!
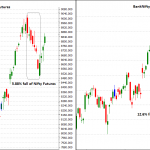

how to calculate fibonacci spot
Dear Narendra
Fibonacci is one of the technical tool used to determine the retracement of the up or down move. You can take the top and bottom level on nifty chart and use Fibonacci retracement of 23.6%, 38.2%, 50% and 61.8%.
Such was developed by the mathematician Leonardo Fibonacci in the thirteenth century which was based on the Fibonacci sequence or golden ratio. You can google “GOLDEN RATIO” or “FIBONACCI SEQUENCE” to get deep info on the subject.