The week started with a follow-up selling of the down move started in late Jan 2015 with market opening up gap down on Monday and closed bearish with a 2.1% loss.
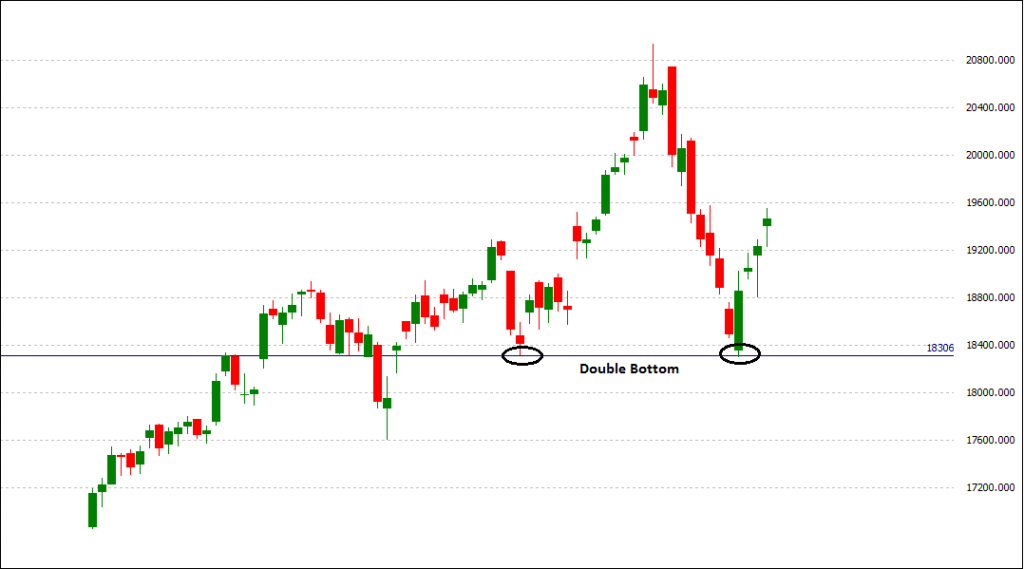
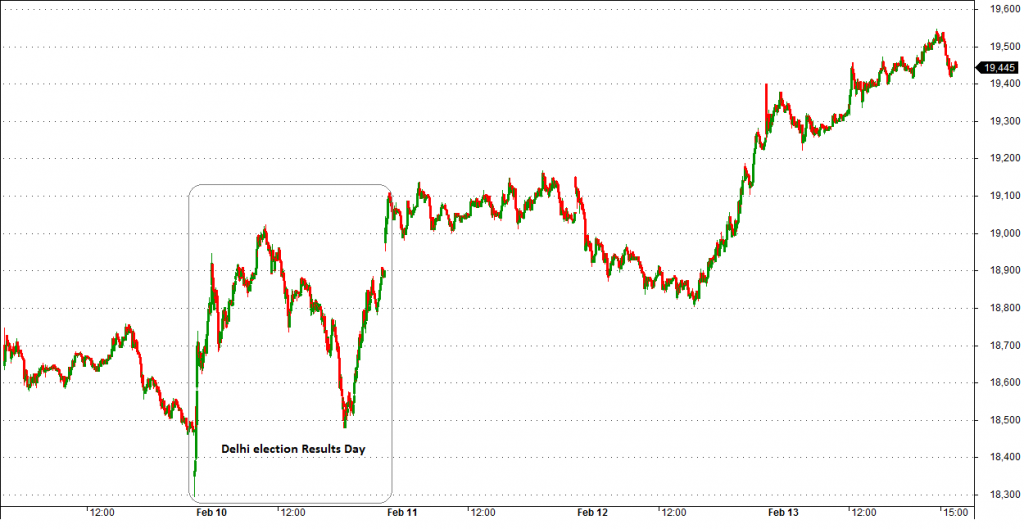
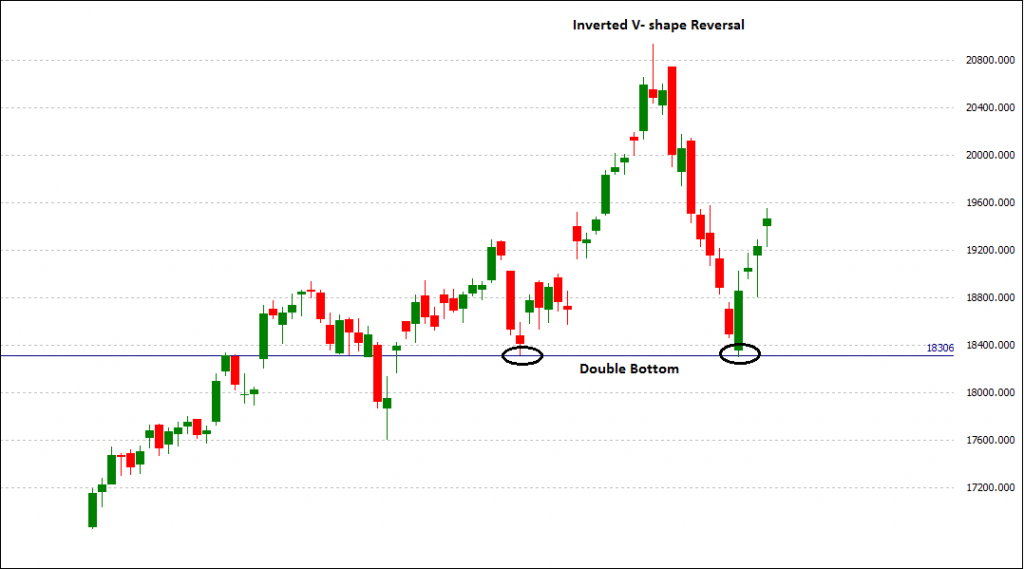
Staged back with another gap down open the next day (when the Delhi election results were to be announced) BankNifty-futures formed up the double bottom approx. at 18300 which led the market to close bullish on the day with a net gain of 2.0% forming up a bullish engulfing bar. After bottoming on the day of AAP Victory in Delhi elections, Bank Nifty was supported by the buyers with all the three days market opening gap up and closing in positive with 1% gain each day.
Refer Chart –I.
This sharp up move was marketed by the media as AAP rally (As the earlier bull move was marketed as Modi wave), but technically speaking the reversal in Bank Nifty was due on cards and we see the market finding reversal at the major support level. So, whether AAP or BJP would have come into picture, the market would have reacted in more or less in the similar manner.
Chart – I, Bank Nifty – Future EOD Chart
The bottom day marked up with a lot of volatility, when Bank Nifty zoomed up 600 points within 30 minutes of the opening (after AAP comes into power for Delhi) and then again fall back more than 500 points and later settled in green by closing some 400 points positive from the last day`s close.
Refer Chart – II
Chart – II, Bank Nifty Future Intraday
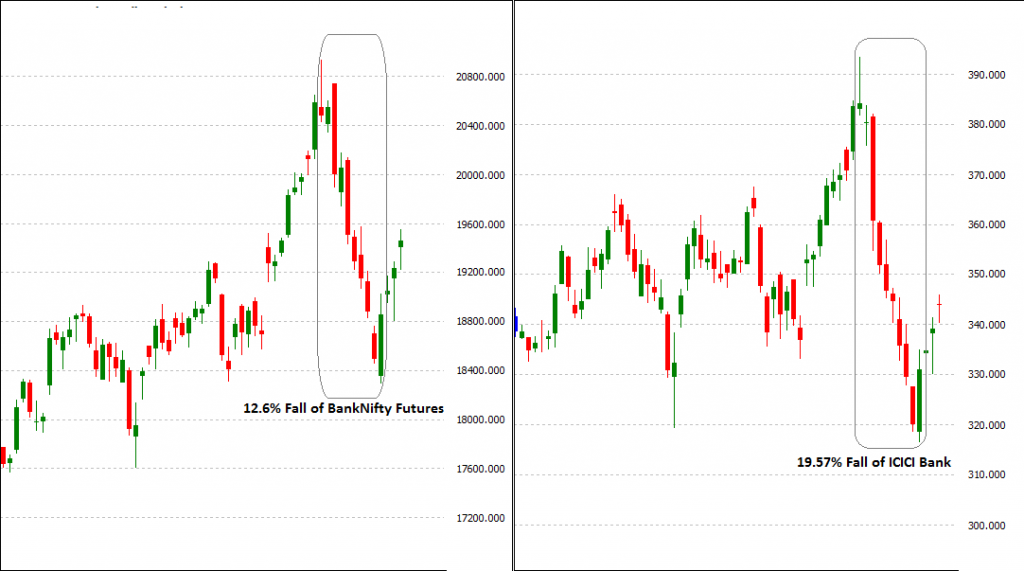
The fall which started from the last week of Jan month led most by the severe fall of the heavyweight ICICI Bank (ICICI Bank has a weightage of 27.6% in the BankNifty Index as on Dec 31, 2014) which fall more than 19% from the top as against the 12.6% fall of banknifty. Refer Chart – III
Read Article to know more about banknifty index & its constituents: What is Bank Nifty Index & How to trade BankNifty?
Chart III – Comparison of BankNifty Future Vs ICICI Bank
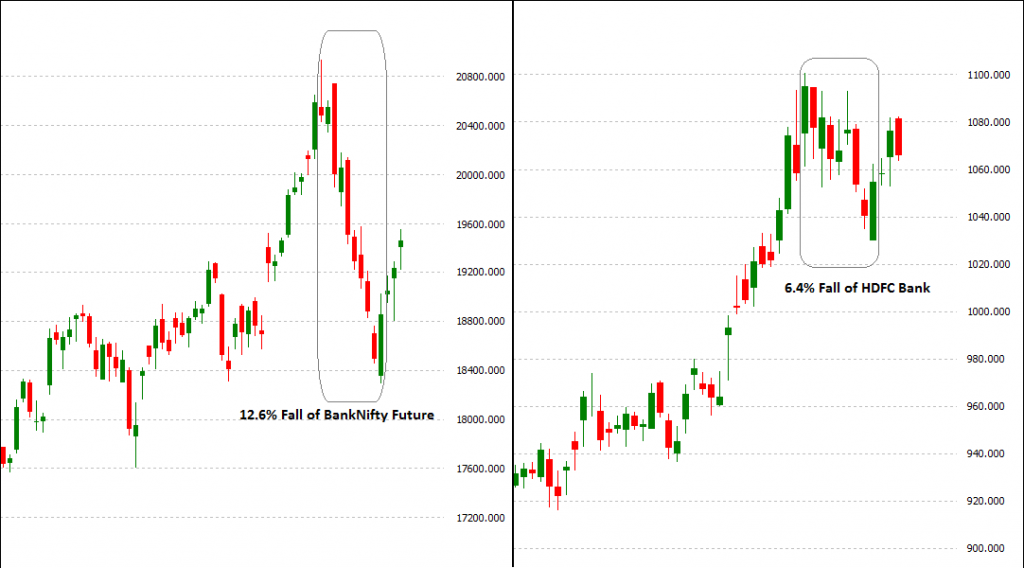
The fall was supplemented by the selling in PNB, Bank India and Bank Baroda which fall 20-25% each after posting quarter results while on the hand, the fall was dragged most by HDFC Bank, IndusInd Bank and YesBank which fall least in the Bank Nifty Index during the same period.
Chart IV – Comparison of BankNifty Futures Vs HDFC Bank
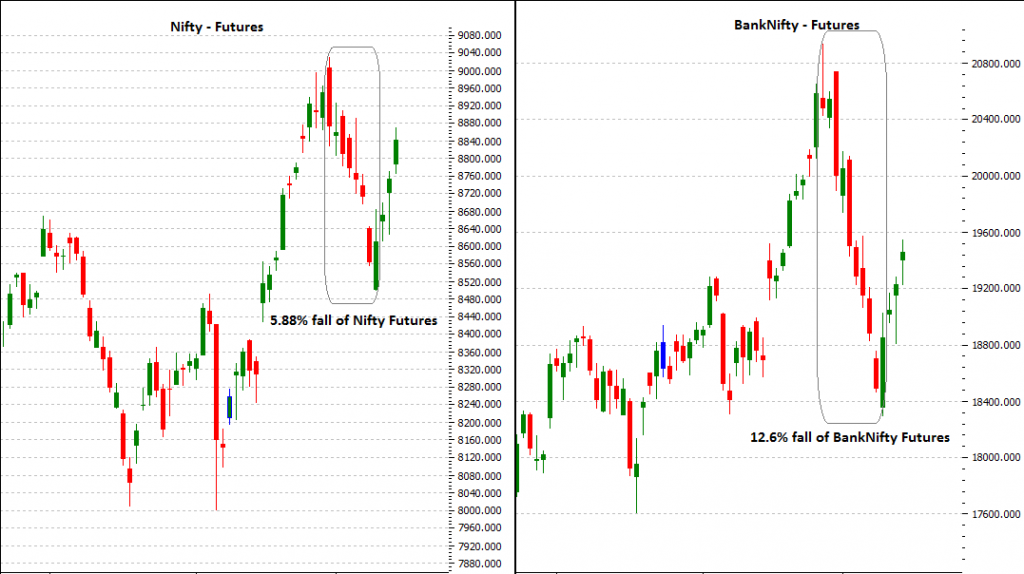
Comparing BankNifty-Futures with Nifty-Futures
From the below chart-V, we can see that Nifty future is outperforming the BankNifty futures by falling less 5.88% compared with 12.6% of the BankNifty index. The recent out-performance is because of the fact that Nifty is finding support by other major indices gaining in green like IT, Pharma and FMCG.
Chart V- BankNifty Futures Vs Nifty Futures
Analyzing BankNifty futures
The reversal which led the market to fall for continuous 9 trading days and losing the full previous up move or some 2600 points (12.5%) forms an inverted V- shape reversal. This sharp fall in the Bull Run makes the market oversold and due for a correction. A sharp up move reversal started after finding support at the major bottom level of the bull market resulting in a 4 continuous positive up move days with a gain of 1255 points.
Chart VI – BankNifty Futures EOD Chart (Inverted V- shaped Reversal)
For the next few trading days, market can find resistance at 19650-19750 and remain in trading range between 19600 to 18800.
Disclaimer – Please note that the post series are our personal view and we advise you to consult your financial advisor before taking any trading decision.
For more, Visit – http://justtrading.in/disclaimer/
Don’t forget to join our Email newsletter for getting more awesome updates. If you find this article informative, do share it on Facebook and Twitter.
KNOWLEDGE IS POWER!
