Trading is one of the best businesses in the world provided one does that on the business lines. As every businessman or professional puts in a lot of time and efforts to learn & understand his or her area of interest in each and every aspect possible and then frame out certain rules and ways to make a success.
But when it comes to trading, many of the enthusiastic beginners enter the trading business and start to trade big in their early stage without proper planning and putting in much needed efforts to attain the market knowledge and understand the framework upon which market movements are based on. They fail to understand that the trading is a business based on certain rules and it requires a lot of patience, learning, efforts and time, just like any professional puts in, to attain knowledge and make a success.
The only way to make trading a successful business is by learning. Spend more time in attaining knowledge about the markets. Never have a fixed idea about anything, be flexible and ready to learn any new about the markets. As more time you will put in gaining the knowledge, the more success you will get later.
So, whatever path you choose to work in the market makes sure that you devote yourself to it as Knowledge is superior & precious than anything in this world.
Technical Trading
Technical`s is the analysis of the records of the buying and selling activity of all the market participants on a whole. As market consist of human beings, backed up with emotions of greed and fear, which tend to behave in similar fashions in similar circumstances and make similar mistakes again and again so we believe that the market movements are nothing but the repetition of past behavior or patterns.
The only best way to record the activity of the markets participants is in terms of the price movement of a particular stock or an index during a period of time. A picture speaks a thousand words that`s why we make up charts and analyze the past movement of the market.
What is a Chart?
Chart is a representation of the price movement of any index or a stock over a period of time. Charts help us to understand how well a particular stock has performed in the history. So, this pictorial representation clarifies the past and the current trading activity of the market participants on a whole which forms the basis of our research of forecasting the future price movement – Remember, Future is repetition of the past.
Basically, There are 3 elements which forms the core of our charts reading:-
Price
Price is the true reflector of the trend of the market because Price registers Demand and Supply. It tell us what the participants are expecting and doing as price cannot go up unless and until there is more buying than selling in the market and vice versa. Price is represented on the vertical axis of the chart and can be drawn in line, bar or candlesticks formats. Price can move in three different ways on the charts – Upwards, Downwards and Sideways.
Time
The second core element of charts is Time. It is represented on the horizontal axis of the chart. Time is used in conjunction with the price. There is a right and proper time for everything – It takes a time for the prices to move up or down and time for accumulation & distribution in the market. We can make up charts from as less as one minute, half hourly, hourly, daily, weekly, monthly, quarterly and yearly charts. As we starts to increase the time frame to trade, it smoothes out the small fluctuations and reduces the disturbance from the charts.
Volume
Volume is the total number of contracts that exchanged hands in the market or any particular stock. It tells us the extent of buyers and sellers enthusiasm in the market. So, there are days when the markets are very dull and days when the markets are very active. Whenever markets are stuck in the price movements then we see a lot of dullness or lack of participation in the market with fewer volumes and on the other side, as and when markets becomes active and starts to slope upwards or fall down very fast, then there is more participation in the market and volumes starts to increase. Volumes and price has a very significant relationship as if with the higher price movement in the market there is less activity of the market participant with less volumes then it gives the warning sign that traders are losing interest in the move and it soon can reverse.
There is another element which is developed by various market participants or researchers during the course of development known as Indicators i.e., Moving Averages (MA), Relative Strength Index (RSI), Moving Average Convergence & Divergence (MACD), and many more…
Chart 1 below displays the Daily Nifty Futures Chart
Chart – 1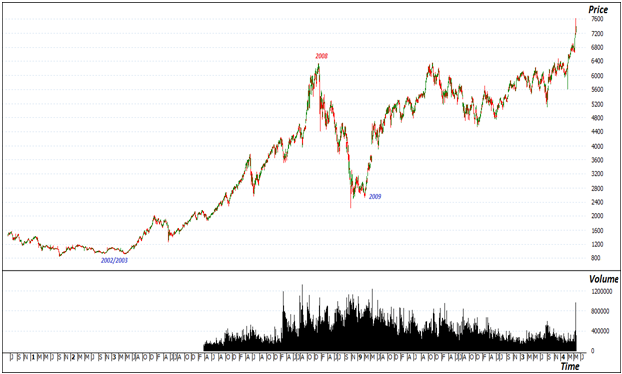
On the vertical (y) axis, Price is displayed in line format with the lowest price hit as 860.30 and highest as 7625 till May, 2014 with the time element represented on the horizontal (x) axis since inception (June 12, 2000) till May 2014 and Volumes is shown at the bottom of the chart.
Indian markets have seen Bull Run from 2002/2003-2008 followed will Bear Move from 2008-2009 and since 2009 we are into a bull move with markets now trading at new All Time Highs (ATH).
Source of Information
Exchange website for Stocks & Index data
Exchange publishes reports of daily trading activity including the price data, blocks deals, Foreign Institutional Investors (FIIs) buying & selling activity.
For traders, Bhavcopy fulfills the need to get the daily price data of all the stocks, futures or index listed on the exchange i.e. Open Price, High Price, Low Price, Close Price and Volume of the day.
Visit the below link to download the Bhavcopy data from the National Stock Exchange (NSE) website.
goo.gl/ixT3hG
Or download the daily Bhavcopy since Nov 1994 from our website
Online Charting Platforms
Many finance websites like Yahoo Finance provides charting platform and beginners can utilize them to learn the basics before buying the advanced technical software’s. Visit the below mentioned link to check the technical chart of the Nifty Index. Same can be utilized to check the stocks charts listed on any exchange.
goo.gl/LIV4V6
KNOWLEDGE IS POWER!