Big Picture Analysis – Ashok Leyland
Price Performance
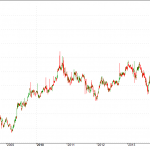
The only stock in the Nifty 50 Index, Nifty Next 50 Index, and NSE Auto Index which is trading at the new all time high`s. Ashok Leyland which was an under performer in the auto space till mid of 2013 started performing and beating most stocks within these last 2-3 years by rallying more than 8 times in 2.5 years from levels of 11.75 (Aug 2013) to 106 now – Refer Chart 1.
Chart 1 – Ashok Leyland EOD Cyclical Chart
Comparison – Nifty Index Vs Ashok Leyland
The Cyclical trend of the stock moves in sync with the Nifty Cyclical Trend where Ashok leyland and Nifty both remains in correction or consolidation from Nov 2010 to Aug 2013 and underwent bull move from August 2013.
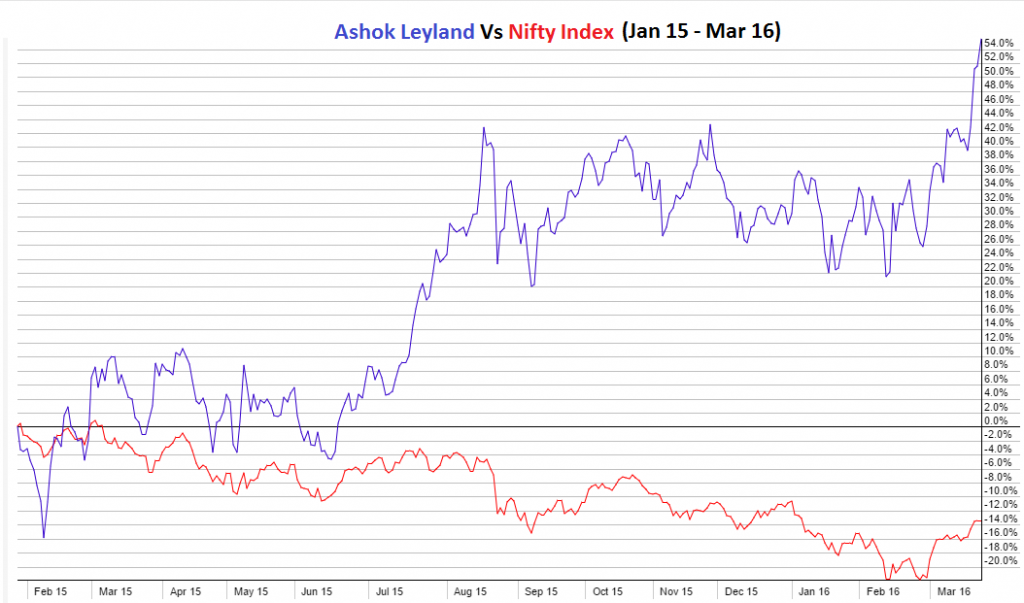
[the_ad id=”3319″]But the stock has outperformed the Nifty Index in the bull market which started in August 2013 by rising more than 800 odd percentage and also outperformed the Nifty Index during the correction of January 2015 to Feb 2016 where Nifty has corrected by more than 20% whereas Ashok Leyland has rallied by more than 20% during the same correction time frame.
Another point to notify here that the stock has rallied by 50% now from Jan 2015 Top level where as Nifty is still down 14% from the level of Jan 2015 top.
Refer Chart 2 where Ashok Leyland (Blue Line) and Nifty (Red Line) Price Performance Comparison has done since Jan 2015.
Chart 2 – Comparison of Nifty Index Vs Ashok Leyland During Cyclical Correction of Jan 2015 – Feb 2016.
Trading Perspective – Ashok Leyland
Now as the general market conditions has improved a bit since Jan 2015 where Nifty has recovered by 10% or so in a months time where other banks, auto, and metal stocks has also recovered back after beaten down badly. Ashok leyland, which outperformed the market by rising by more than 20% during the corrective phase of the Nifty Index, has started to perform well and had a price breakout out of its big consolidation band between price levels of 100 to 78 from August 2015 to February 2016.
Ashok Leyland has a Bullish consolidation breakout with positive closure on the weekly chart with total volumes of 6.51 Crore shares which seems to be average as per 200 day average volume of 5.5 crores – Refer Chart 3
But as this was a holiday week with only 3 trading days, we should not negate the importance of the bullish breakout in recovering market with this being the only stock performing well since 2015 correction amongst the NSE top 100 stocks.
Chart 3 – Weekly Candlestick Chart of Ashok Leyland
In sync with the Weekly chart, Ashok Leyland has given a breakout on the daily chart on last Monday (Mar 21st, 2016) with big bullish closing bar above previous tops of 99.65 and that too with 2.9 crores volumes on the bullish breakout day which is much more than 200 day average volume of 1.35 crore shares.
The stock can be traded long from positional trading perspective by maintaining a stop loss under 100. If the stock sustains the big time breakout (which seems to have higher probability) can target the price level of 120-125 by keeping stop under 100.
For those who wishes to enter with further close stop loss or those who are only day trading stocks can consider to buy the stock on correction with stop losses as per their risk management rules or under the previous bottoms. One can also pyramid the buying process to enter stock in tranches on positive price moves and trail stop losses on upside to keep up with their money management rules to protect capital & profits.
Read More about the stock @ Ashok Leyland – A flagship of Hinduja Group.
To view Technical Daily Chart Visit our Technical Chart Section @ AshokLey NSE Technical Chart.
For those who are New to Trading Business, Here are a couple of “Must Read” articles to help you to learn more about Charting, Nifty Index, Trading Rules to keep you Safe in the Market, Importance of Developing a Trading Plan, Money Management, Pyramiding etc.
– Getting Started with Charting – What is a Chart?
– What is Nifty 50 Index (Nifty) & How to Trade Nifty?
– 20 Golden Quotes by Warren Buffett – A Must Read for Every Investor
– 12 Step-wise Trading Rules for New Traders to be Safe in the Market
– Part IV – Getting Started With Trading – Importance of Developing a Trading Plan
– How a 14 year Old Kid Transformed Himself to Become the Greatest Trader of the Wall Street?
As we are trying to constantly improve, we would be really happy if you can share some of your ideas, suggestions on how we can further improve our Knowledge Center, the articles we should write, etc to support all the new aspiring traders & experience ones to improve their trading skills & knowledge to make right decisions in their respective trading journey? You can do so in the Comment Section below or on our Q&A Page, or on Facebook.
Any feedback would be much appreciated.
Please let us know if you have any further questions; We are more than happy to help.
To know more about us Please Visit: About JustTrading.in
Disclaimer: Please note that all the information, views, opinions or examples shared are solely for the general information purpose only and doesn`t furnish any investment strategy or advice. JustTrading.in advises you to consult with your certified professional finance advisers before making any investment or trading decisions. For more, Please Visit & Read: Disclaimer
KNOWLEDGE IS POWER!